How To Generate Forex Signals Using Rectangles
Today, I want to teach you how to use rectangles to generate trading signals in forex.And I also going to apply this method to analyse what is currently going on in the market. I am also going to use the analysis to forecast the most likely direction of the market for this week.That means we are going to use this method to generate entry, and exit signals today against next week trading.
Rectangles can occur in any time frame and any market you are following. As with many chart patterns the pattern is in the eye of the beholder. I have found that some traders are better than others at identifying chart patterns. It may take some time before you can spot the most common patterns.
Rectangles can occur in any time frame and any market you are following. As with many chart patterns the pattern is in the eye of the beholder. I have found that some traders are better than others at identifying chart patterns. It may take some time before you can spot the most common patterns.
The
rectangle contains price movement between two points in a rectangular
shape to which we add lines to signify the upper boundary and lower
boundary. These lines should be horizontal. Slanted rectangle will most
probably fall into the realm of ''Flags'', which we will discus in
another lesson.
The
top line should connect at least two bars and the bottom line should
connect at least two bars. As most markets are in congestion most of the
time rectangles are fairly common.
It
is not necessary to draw the top and lower lines at the extreme of the
congestion points but rather make sure the lines contain at least 95% of
the congestion area. The longer the rectangle continues the more
important the breakout.
To
help identify a valid breakout there should be an increase in volume on
the day (or time period) of the breakout. The breakout can occur in
either direction but if you are in a defined up trend then an upside
breakout is favored and vise versa for a down trend. If I am in a
defined trend then I tend to view this pattern as a continuation patter
unless it starts to break the other way.

There
are a number of ways to trade the rectangle. You can buy or sell the
breakout as it happens or you can wait to see if there is a pullback to
the neckline (see charts). Once you have defined the rectangle you can
also buy and sell at the boundaries of the rectangle. I prefer to buy at
the lower boundary if in an up trend and sell at the upper boundary if
in a down trend. This can be a very effective trade as the risk is
small. If you sell at the upper boundary then your stop loss can be
close to the boundary and vise versa for the long trade at the lower
boundary.

If
you sell the breakout place your protective stop inside the rectangle
and do the same for buying the upside breakout. You can also measure the
distance between the upper and lower boundaries and project the
distance forward to get an indication of the size of the next move.
GBPSUSD Signal for (Nov.1 to Nov. 5 2016)
Now we want to use this method to generate signal for next trading week.

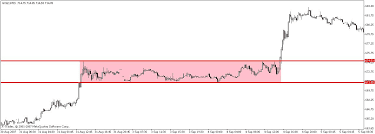
We are going to use the GBPUSD chart above to buttress the teaching. The pair has been trapped within the prize zone of 1.2375 and 1.2088 for over ten days now.This is about 290 pips range. 287 Pips to be precise. Now we have a rectangular formation.What do we do with this?
This kind of formation usually leads to a strong breakout. It is a high momentum signal.In the next trading week, we expect that the pair would breakout of this long price range.Hence, our bias is as follow:
GBPSUSD Signal for (Nov.1 to Nov. 5 2016)
Now we want to use this method to generate signal for next trading week.

We are going to use the GBPUSD chart above to buttress the teaching. The pair has been trapped within the prize zone of 1.2375 and 1.2088 for over ten days now.This is about 290 pips range. 287 Pips to be precise. Now we have a rectangular formation.What do we do with this?
This kind of formation usually leads to a strong breakout. It is a high momentum signal.In the next trading week, we expect that the pair would breakout of this long price range.Hence, our bias is as follow:
SHORT:
Entry price= 1.2078
Stop loss=1.2178
Take profit 1 = 1.1978
Take profit 2 = 1.1878
Risk = 1% of current equity
LONG:
Entry price = 1.2385
Stop loss = 1.2285
Take profit 1 = 1.2485
Take profit 2 = 1.2585
Risk = 1% of current equity
posted by Oyewole Olatunbosun @ 06:17
1 Comments
![]()

1 Comments:
It is beautiful that GBPUSD hit out tp1 and tp2 this week.More of it.
Post a Comment
Subscribe to Post Comments [Atom]
<< Home