How to use 50 and 200 EMA
Moving averages are indicators widely used by forex traders.Although there is no optimum parameter for any technical indicators such as moving averages, yet experience has proved that 50 and 200 are reliable and good settings that can be used to identify the general market direction.It is also to the best of my knowledge that professional traders pay careful attention to price action and reaction around the 50 EMA and 200 EMA.The next question is, how do senior traders apply these moving averages?
The market movers (experts and large fund managers) do use 50EMA and 200EMA to filter noise and determine trend direction.Noise occurs when there is no clear-cut direction in the market.This is usually a sideway or ranging market scenario. Trend traders tend to stay out of this kind of situation and so they need to know when buyers are leading or when they are lagging or when the buyers and sellers are in phase.This is where the moving average plays a pivotal role.It is generally accepted among traders that when the 50 EMA is moving above the 200 EMA and the market price is moving above the 50EMA, then we have an uptrend.So traders should wait for the bearish retracement towards a value area which is the best level to buy the pair.

Similarly, when the 50 EMA is moving below the 200EMA and the market price is moving below the 50EMA, then we have a downtrend.So traders should wait for the best bullish retracement level to sell the pair.

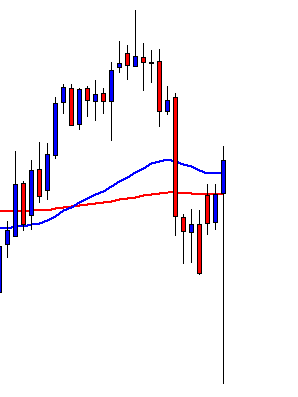
The EURUSD daily chart above shows that the blue moving average which is the 50EMA is moving below the red moving average which is the 200EMA. Also, the red candle is moving below the blue moving average.This means the pair is in a downtrend.It is a safe practice to sell high in a confirmed downtrend.So, we need a bullish retracement in a downtrend to open a short position.
It is not enough to know the trend, in order to trade sensibly, we need to know where it is safe and profitable for us to join the trend even though we know that the trend is our friend.The simple rule is to "buy low and sell high and sell high and buy low."
To do this we need to switch to lower time frames like 4 hour and check what is happening.When 50 and 200 EMA indicates uptrend on daily chart, we will switch our chart down to 4hour time frame and wait for the 50 and 200 EMA to indicate downtrend.This means that we have a downtrend on 4 hour and uptrend on daily chart.The downtrend on the 4 hour chart is the bearish retracement of the bullish move on daily. We need patience to wait until we have confluence on the 4hour time frame. That is , we need to wait for the expiration of the bearish move on 4 hour and grab any logical selling opportunity that occurs at the break above either 50 EMA or 200 EMA on 4hour time scale.
Then we will buy just above the 50 EMA or 200 EMA with our take profit on the next resistance on daily time frame.

The chart above is USDCHF 4hour chart in which the trend was down and now bullish. Now we have a confluence on daily and 4hour charts.The decision is to buy on 4hour as the blue candle rises above the red moving average and place take profit at 0.9997 which is the next resistance on daily chart. Our stop loss should not exceed half of our take profit and a good trailing stop like 80 pips should be applied.
Another good example is the signal from the EURUSD daily chart below, we know that the prevailing trend is down.


posted by Oyewole Olatunbosun @ 08:50
0 Comments
![]()

0 Comments:
Post a Comment
Subscribe to Post Comments [Atom]
<< Home