How To Generate Forex Signals Using Fibonacci Retracement,Trendline & 30EMA Moving Average
The Fibonacci retracement tools plays a vital role in technical analysis of the forex market because it particularly helps to gauge the extent of a retracement or correction and extension of a trend during resumption.While there could be diverse methods of drawing the tools, the conventional method will be discussed here.
So, the Fibonacci retracement tools is usually drawn from swing low to swing high in a downtrend with the 0% level on the swing low and 100% on the swing high. In a downtrend, a rise in price is considered a minor trend or retracement of the major trend.

The conservative traders do take the levels 38.2 and 61.8 as the most important retracement levels. However, observations from price actions have bountifully shown that level Fibo 50% tends to be more formidable in recent times.
The drawing is reversed during an uptrend.That, we have in an uptrend that the Fibonacci retracement tools is usually drawn from swing high to swing low such that the Fibo 0% is fixed on the swing high and Fibo 100% on the swing low. In an uptrend a fall in price is considered a minor downtrend or bearish retracement of the major uptrend or bullish.

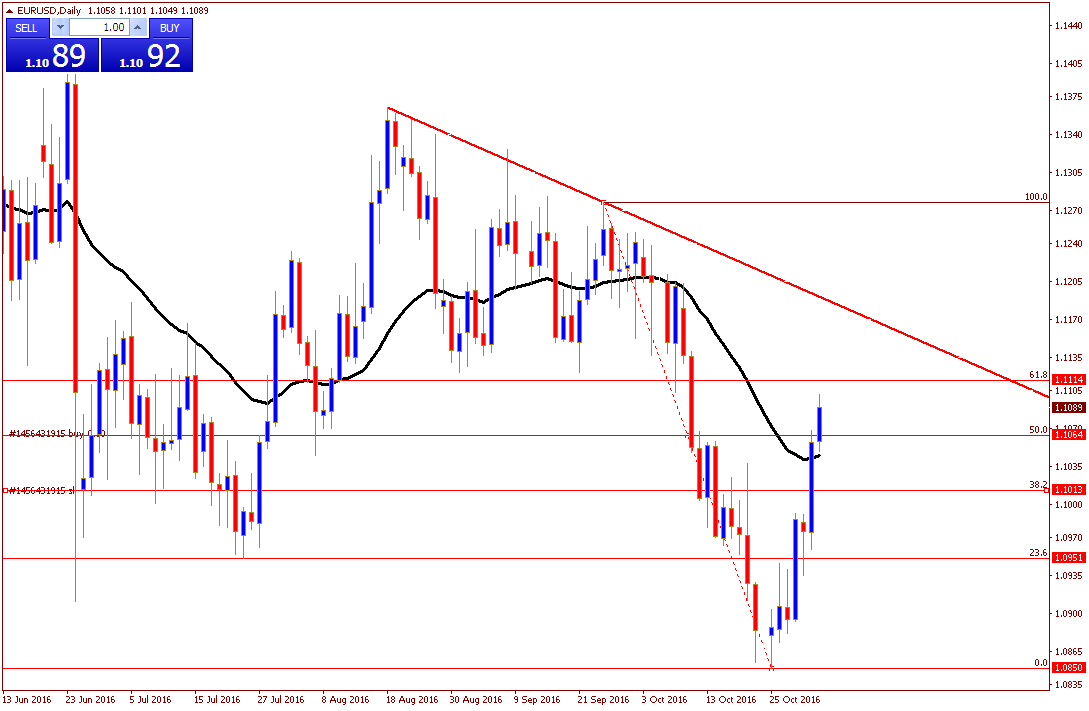
The level 0.0 is placed on the recent swing high and level 100.0 is placed on the recent swing low on the chart above.The chart shows that price retraced down to level 50.0 and slightly below it without reaching level 61.8 then pulled back up from there.The two charts above show how fibonacci retracement are drawn both in an uptrend as well as during downtrend in the forex market.
Similarly, trendline connects two consecutive swing lows or two consecutive swing highs.If the trendline rises from left to right then we have an uptrend

and if it falls from left to right then we have a down trend.

Example 1 [EURUSD Signal for (Nov.1 to Nov. 5 2016) ]
Base onthe current scenario in the market, I have updated the signal today the 2nd of November 2016.
Example 2 [EURUSD Signal for (Nov.1 to Nov. 5 2016) ]
Now we want to use this method to generate signal for next trading week.

From the EURUSD daily chart above, we can see that price is moving well below the black 30EMA. This suggests a downtrend. The falling blue trendline also confirms the that the prevailing trend is bearish.Therefore we will consider any rise as a counter-trend move ( retracement of the fall). This means buyers should tread with greater caution under the current market scenario.Sellers have the resultant force in a bearish trend. Hence we are going to remain selling the pair next week until the market changes phase.
The signal is to sell when price pulls back to level 23.6 which is1.0950.
Therefore, we will sell the pair next week if price returns to 1.0950 with take profit 1 at 1.0850. Our stop loss will be 50 pips. I always recommend a risk of 1% or at most 2%. Happy trading!
posted by Oyewole Olatunbosun @ 07:31
0 Comments
![]()

0 Comments:
Post a Comment
Subscribe to Post Comments [Atom]
<< Home