How to trade forex support and resistance
The market prices continuously move at a speed which tends to vary with time and activity.
The movement of price is roughly wavy on charts and this creates two distinct levels called resistance and support. We need to clearly differentiate between these two price levels.
Support is the low price at which currency price temporarily stops going lower and momentarily reverses from downward direction to the upward.
Resistance on the other hand is the high price at which a currency price stops going higher and starts going down.
The diagram below clearly shows typical price support and resistance levels.The general direction of the forex market price is about net force of attraction or repulsion generated around support and resistance levels. Traders expect any significant support to prevent bearish breakout in an uptrend. Similarly, they expect a true resistance to disallow bullish breakout in a downtrend.
Careful observations have shown that prices are reluctant to break major support but are eager to break resistance during an uptrend. The converse of the statement is also true.
There are various kinds of support and resistance which include: Fibonacci levels, moving average support and resistance, horizontal support and resistance as well as trendline support and resistance.The ones that we will look into and apply today are horizontal support and resistance levels.
Horizontal support and resistance levels are the clearest price level on a chart as it can be drawn through swing lows or swing highs or just candle`s highs or lows.
It depends on the scenario and the time scale of choice. The basic rule is that when price breaks a support level, the support becomes old and changes automatically to a new resistance level and when price breaks a resistance level, the resistance becomes old and changes automatically to a new support level.
How To Trade Around Support and Resistance
When a resistance is broken by market forces, we have what we call a "resistance-turned-support".
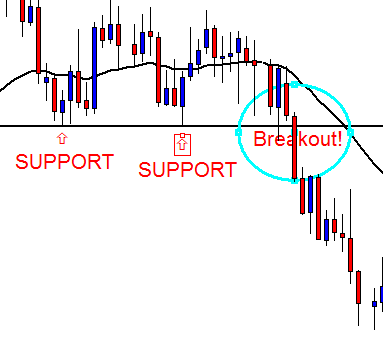
The two swing lows above present a strong price support levels that the price finds hard to break. Conservative traders believe that this strong support level is technically broken when price bar successfully closes below it.Then they expect a significant fall for a good amount of time which could run for hours or days or even weeks.
Generally, price can either break down a support and fall through it tradably or occasionaly, it may also fail to break through the support upon one attempt or two and bounces up further.This is obvious from the blue candles above which slightly bounced of the support and moved back up.
The evergreen rule of thumb is that the frequency of bounce from a particular price level is a measure of the strength of that level. Hence, it implies that a bounce off support makes the support stronger and a future break of such level leads to huge momentum.
Furthermore, if a bounce from a support does not produce enough rally (upward movement) then a major breakout below the support is looming.
The immediate chart above shows that a major bearish breakout occurred at the third attempt by the bearish pressure. The fall went far below this strong support that has been existing for some days.
As seen, neither of the bounces above the level produced any upward move as significant as the fall. Hence, the huge bearish breakout happened eventually as expected.
Now let us consider the bullish scenarios at the resistance level too.
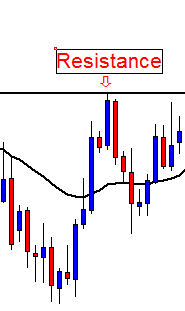
The red arrow above labels the high of a blue candle. Coincidentally, the arrow also labels the turning point which we call a "swing high or price resistance level". A smooth horizontal line drawn through a swing high will clearly show the resistance line on the chart.The chart also shows how price later formed a swing low after the swing high.It can be seen that price is now moving up from the recent swing low and heading towards the resistance (swing high) again.
Whenever this kind of formation occurs, some traders expect price to break the swing high and move up above it while some anticipate that price will bounce off away from the swing high and return downwards significantly like a tennis ball hitting a ceiling.
Eventually, the bulls (buyers) are in charge as the price blew away the resistance and went further up.It means no show for the bears at that time. This is because during an uptrend, it is easier for price to break a resistance than to break a support.
A practical example:
Price bounces off an old support now turned resistance:
Our effort is to determine how to use the explanation above in our day to day forex trading.The EURUSD daily chart above shows that price is moving below the current support red line and also below the most recent resistance blue line.Remember that any broken support automatically becomes resistance. Hence, the red line has now become resistance to any upward tendency of price.
It is obvious that the market is now in a downtrend and as such it is expected that the bullish pressure will be strongly resisted by the nearest significant resistance. And we saw that price bounced off back to the down side.
The practice is to sell the pair at the pull-back to the red line which is a support-turned -resistance.
I hope this helps you.If so, please read other artcles on this blog and let me know if you have any questions.I will equally appreciate your comments.
Trade sensibly!
Oyewole Olatunbosun
I can write original
articles for your blog on any forex trading topic of your choice.


0 Comments:
Post a Comment
Subscribe to Post Comments [Atom]
<< Home