Tuesday 8 March 2016

How To Use Forex Rectangles As Breakout Trading System

Rectangles can occur in any time frame and any market you are following. As with many chart patterns the pattern is in the eye of the beholder. I have found that some traders are better than others at identifying chart patterns. It may take some time before you can spot the most common patterns.
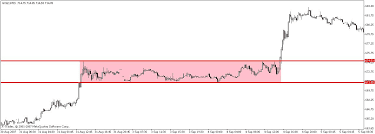
The rectangle contains price movement between two points in a rectangular shape to which we add lines to signify the upper boundary and lower boundary. These lines should be horizontal. Slanted rectangle will most probably fall into the realm of ''Flags'', which we will discus in another lesson.

The top line should connect at least two bars and the bottom line should connect at least two bars. As most markets are in congestion most of the time rectangles are fairly common.
It is not necessary to draw the top and lower lines at the extreme of the congestion points but rather make sure the lines contain at least 95% of the congestion area. The longer the rectangle continues the more important the breakout.
To help identify a valid breakout there should be an increase in volume on the day (or time period) of the breakout. The breakout can occur in either direction but if you are in a defined up trend then an upside breakout is favored and vise versa for a down trend. If I am in a defined trend then I tend to view this pattern as a continuation patter unless it starts to break the other way.


There are a number of ways to trade the rectangle. You can buy or sell the breakout as it happens or you can wait to see if there is a pullback to the neckline (see charts). Once you have defined the rectangle you can also buy and sell at the boundaries of the rectangle. I prefer to buy at the lower boundary if in an up trend and sell at the upper boundary if in a down trend. This can be a very effective trade as the risk is small. If you sell at the upper boundary then your stop loss can be close to the boundary and vise versa for the long trade at the lower boundary.


If you sell the breakout place your protective stop inside the rectangle and do the same for buying the upside breakout. You can also measure the distance between the upper and lower boundaries and project the distance forward to get an indication of the size of the next move. If the distance from the upper to the lower boundary were 20 ticks then I would expect the next move to be at least 20 ticks...Read more


My Recommendation:

 EA that earns astonishing 50% per month  with low draw 
Also compatible with with US brokers.

Make deposit into your trading account and get 250% instantly.


Monday 7 March 2016

Trading The Retest of Forex Support and Resisitance


Learning to understand and effectively use support and resistance was a major turning point in my own trading. It is essential when trading that you find something that make sense to you, that you understand and believe in and that you are able to build a solid trading plan around. Support and resistance levels can at first seem quite difficult to engage as the levels may seem tricky to identify and this is why it is crucial that you firstly learn to properly identify support and resistance levels in the market and begin to understand how price reacts around them so that you are able to then move on to trading them.

The most basic way that we look to use support and resistance levels is to fade them, whereby we look to buy into support and sell into resistance. This type of strategy can work well initially with clearly defined levels as price moves into them for the first few times. However, as we build our Forex knowledge and start to learn more about how the market works we can start to take advantage of further dynamics at play around these important levels.


Understanding Order Flow
As we know, the reason that support and resistance levels exist is due to the underlying order flow in the market. A build up of buy orders creates support and a build up of sell orders creates resistance. Each subsequent time these levels are tested, the order at the level are eroded as more participants enter the market. Eventually, upon enough probing these orders giver way and the supply/demand balance shifts.

For example, as a surge in buying creates a support area, we see price bounce as buy orders are filled. If price then returns to that area we see further reactions higher as those buy orders not filled first time around are filled along with fresh buying. Subsequent returns to the level may similarly be met with further buying but eventually as all original buy orders are filled and fresh buying dries up to due to the lack of momentum we see a shift in the supply/demand scale and supply outweighs demand to take price lower.

USDCHF


Trading The Retest
The typical guidelines espoused for trading support and resistance suggest that the more times a specifics level or area is tested the stronger it becomes. Whilst it is true that levels displaying many tests are indeed strong, the idea that these levels become stronger with each touch is actually the opposite of what is happening due to the order flow dynamic we just discussed. An understanding of this dynamic paves the way for new trading opportunities in the market.

As broken support indicates the dominance of supply over demand in the market we need to adapt our view. The area that was once support, created by strong demand, now becomes resistance, created by supply. Where we previously might have looked to buy at that area, anticipating a reaction higher we can now look to sell, anticipating that as price returns to that level sell-orders previously unfilled will be filled along with potentially fresh selling interest. 

USDCHF

Trading the retest of key levels in the market can be an extremely simple yet powerfully effective trading strategy. The beauty of the idea is that due to the underlying order flow creating the setup, you can really trade this on all time-frames as the same dynamic plays our over and over again on different scales. Even within the large example we are looking at I can clearly identify setups that would have been fantastic lower time-frame trading opportunities. 

USDCHF

Lets zoom in further on the rectangular area highlighted in the chart above.

USDCHF


Can you see how exactly the same setup occurs on the lower time-frame? The very order flow dynamic that we were looking at in our larger 4hour chart setup is seen here working in precisely the same way on the 1hour charts.

Creating A Trading Plan
Once you have a raw trading idea in place such as we have here, you then need to think about really firming the idea up and shaping a solid trading plan that you can construct rules for, allowing you to consistently engage the market based on your plan.

Things to think about:
Will you simply trade a retest of the level or will you look for further confirmation such as identifying key price action signals? Alternatively, will you look to combine an indicator to act as a filter for your trades?

If you are looking to build indicators in to you system, Order Flow Trader can be a fantastic tool to use in these scenarios whereby you look to enter on an Order Flow Trader signal given as price reacts to the level retest. 

USDCHF

Furthermore, you must consider your stop loss placement. Will you use structural levels such as recent key highs or lows, or will you use an ATR based stop considering the volatility of the instrument in your placement. If you use ATR based stops you should definitely check out our ATR Boundaries indicator which is an incredibly effective upgrade of the classic ATR indicator and can...Read more

My Recommendation:
 EA that earns astonishing 50% per month  with low draw 
Also compatible with with US brokers.

Make deposit into your trading account and get 200% instantly.


Which Is The Worst ForexTrading Strategy?

 The worst Forex trading strategy I`m referring to, which is simply the worst Forex trading strategy I have ever encountered, is known as averaging down. This horrifying Forex trading strategy is the process of buying more shares that you had previously acquired, as the price drops.

Traders often purchase shares this way in an effort to reduce their initial entry price.
Only bad investors average down by buying shares of a sinking assests to decrease their overall average price per share. This Forex trading strategy is hardly ever effective, and is often like throwing good money after bad. It also magnifies a trader`s loss if the share keeps dropping. Remember, just because a share is cheap now that doesn`t mean it`s not going to get any cheaper. However, let`s examine how this devastating Forex trading strategy works. Say you bought one thousand shares at $40.
The novice investor may not have a stop loss in place, and the share price falls to $30 dollars. Here comes the stupidity of this Forex trading strategy — to average down the novice trader might by another thousand shares at $30 to lower the average cost per share that he`d already purchased. So, his average cost per share would now be $35.
Unfortunately, the share price may fall even further, and the novice trader will again buy more shares to reduce the average cost per share. They end up buying more and more into a share that`s losing their money.

Now, imagine this Forex trading strategy being applied to a portfolio of assets. In the end, all the capital will automatically be allocated to the worse performing assets in the portfolio while the best performing assets are sold off. The result is, at best, a disastrous underperformance versus the market.

If a trader uses an averaging down system and uses margins, their losses will be magnified even further. The biggest problem with this Forex trading strategy is that a trader`s gains are cut short, and the losers are left to run. My advice is — never average down. The process of buying a share, watching it fall, and then throwing more money at it in the hopes that you`ll either get back to break even or make a bigger killing is one of the most misguided pieces of advice on Wall Street. Never be faced with a situation where you`ll ask yourself, Should I risk even more than I originally intended in a desperate attempt to lower my cost and save my butt?`
Instead, design a simple, robust system with ...Read more


My Recommendation:
 EA that earns astonishing 50% per month  with low draw 
Also compatible with with US brokers.

No deposit is required. Just register and get $500 bonus.