Monday 22 May 2017

How to trade forex support and resistance

The market prices  continuously move at a speed  which tends to vary with time and activity.
The movement of price is roughly wavy on  charts and this creates two distinct levels called resistance and support. We need to clearly differentiate between  these two price levels.

Support  is the low price at which currency price temporarily stops going lower and momentarily reverses from downward direction to the upward.

Resistance on the other hand is the high price at which a currency price stops going higher and starts going down.


The diagram below clearly shows typical price support and resistance levels.The general direction of the forex market price is about net force of attraction or repulsion generated around  support  and  resistance levels. Traders expect any significant support to prevent bearish breakout  in an uptrend. Similarly, they expect a true resistance to disallow bullish breakout in a downtrend.

Careful observations have shown that prices are reluctant to break major support but are eager to break resistance during an uptrend. The converse of the statement is also true.

There are various kinds of support and resistance which include: Fibonacci levels, moving average support and resistance, horizontal support and resistance as well as trendline support and resistance.The ones that we will look into and apply today are horizontal support and resistance levels.

Horizontal support and resistance levels are the clearest price level on a chart as it can be drawn through swing lows or swing highs or just candle`s highs or lows.
It depends on the scenario and the time scale of choice. The basic rule is that when price breaks a support level, the support becomes old and changes  automatically to a new  resistance level and when price breaks a resistance level, the resistance becomes old and changes automatically  to a new support level.

How To Trade Around Support and Resistance 
When a resistance is broken by market forces, we have what we call a "resistance-turned-support".


The two  swing lows  above present a strong price support levels that the price  finds hard to break. Conservative traders believe that  this strong support level is technically broken when price bar successfully closes below it.Then they expect a significant fall for a good amount of time which could run for hours or days or even weeks.

 Generally, price can either break down  a support and fall through it tradably or occasionaly, it may also fail to break through the support upon one attempt or two and bounces up further.This is obvious from the blue candles above which slightly bounced of the support  and moved back up.

The evergreen rule of thumb is that the frequency of bounce from a particular price level is a measure of the strength of that level. Hence, it implies that a bounce off support makes the support stronger and a future break  of such level leads to huge momentum.
Furthermore, if a bounce from a support does not produce enough rally (upward movement) then a major breakout below the support is looming.


The immediate chart above shows that a major  bearish breakout occurred at the third attempt by the bearish pressure. The fall went far below this strong support that has been existing for some days.
As seen, neither of the bounces above the level produced any upward move as significant as the fall. Hence, the huge bearish breakout happened eventually as expected.

Now let us consider the bullish scenarios at the resistance level too.
 The red arrow above labels the high of a blue candle. Coincidentally, the arrow also labels the turning point which we call a "swing high or price resistance level". A smooth horizontal line drawn through  a swing high will clearly show the  resistance line on the chart.The chart also shows how price later formed a swing low after the swing high.It can be seen that price is now moving up from the recent swing low and heading towards the  resistance (swing high) again.
Whenever this kind of formation occurs, some traders  expect price to  break the swing high and move up above it  while some anticipate that price will bounce off away from the swing high and return downwards significantly like a tennis ball hitting a ceiling.
Eventually, the bulls (buyers) are in charge as the price blew away  the resistance and went further up.It means no show for the bears at that time. This is because during an uptrend, it is easier for price to break a resistance than to break a support.

A practical example:
Price bounces off an old support now turned resistance:
Our effort is to determine how to use the explanation above in our day to day forex trading.

 The  EURUSD daily  chart above shows that price is moving below the current support red line and also below the most recent resistance blue line.Remember that any broken support automatically becomes resistance. Hence, the red line has now become resistance to any upward tendency of price.
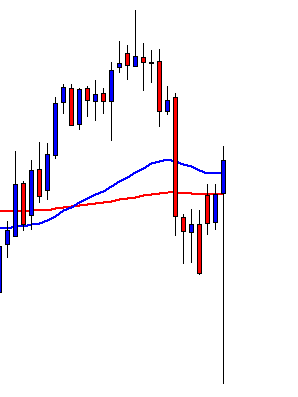
It is obvious that the market is now in a downtrend and as such it is expected that the bullish pressure will be strongly resisted by the nearest significant resistance. And we saw that price bounced off back to the down side.
The practice is to sell the pair at the pull-back to the red line which is a support-turned -resistance.
I hope this helps you.If so, please read other artcles on this blog and let me know if you have any questions.I will equally appreciate your comments.

Trade sensibly!
Oyewole Olatunbosun

I can write original articles for your blog on any forex trading topic of your choice.
Meet me on fiverr now


How to use fibonacci retracement to enter trade during uptrend

We need to make it clear to forex traders, especially the new ones, that Fibonacci tool functions per excellence in a trending market.The tool is designed with the aim to detect possible important region of reversal of minor trend and continuation of major trend. Therefore in an uptrend, fibonacci retracement shows the possible price zone where minor trend(downtrend) may stop and reverse and where the major trend (uptrend) may resume and continue.
Traders go long at the support in an uptrend and go short at the resistance in a downtrend.The Fibonacci retracement levels also indicate the significant support levels in an uptrend and show resistance in a downtrend.Therefore, traders need to know how to draw this tool correctly on an MT4 chart.

Bearish retracement is expected to occur in an uptrend.And the Fibonacci tools can be used to gauge the extent of such retracements.
This particular post is written to explain how to draw and use the tool in spotting support levels during bearish retracement of an uptrend. Major retracement levels are levels 38.2%  and 61.8%. These two numbers indicate  the most important value areas during retracement. Market tends not to retrace more than 38.2% during a very strong trend.However, most retracements get to level 61.8%.
We know that fibo 38.2%  and 61.8% are not perfect levels and we equally know that  there is no perfect tool in the market. However, we can say it again and again that the majority of traders do watch these two golden numbers.That is why they work! Remember that trend also means  the direction of transactions of the majority.

One needs to determine the recent swing high and swing low before drawing the tool.During uptrend, Fibonacci retracement is drawn by
-Pick the Fibonacci retracement tool and
- Drag from from swing low, then
-Drop it on the swing low.
By doing these we will have the 100% on the swing low and the 0% on the swing high.This is because we can only have bearish retracements in uptrends.So, we consider the swing high as the origin of the bearish retracement (0 % ) and and swing low as the ultimate end of the retracement (100%).
The chart below shows fibo retracement 38.2% in action.


When traders apply fibonacci retracement tool to the  chart  like the one above,they expect that the fibo 38.2% is support level that is highly likely to halt the fall and usher in another rise in price.

Fibonacci retracement is drawn by picking the Fibonacci retracement tool and dragging it from swing low to swing high and then drop, we have the level 0.0%  placed on the recent swing high and level 100.0%  placed on the recent swing low. A trader therefore reads that the price has retraced the level 38.2%.

 It is widely accepted among traders that levels 38.2%  and 61.8%  are the most important retracement levels.The sellers will be closing their positions in profit around these levels or atleast protect them. Also, buyers will be watching out for price actions around this level to know when exactly to join the upward price movement.

The forces that move the market do not exist in a vacuum.The market is 100%  psychological and psychology is a vector quantity which means that it has  direction and size.People look for reasons to buy or sell a given pair at a particular time.This is what we call either technical or fundamental  analysis.This psychological nature of the  market is what empowers technical indicators to work. Therefore, any form of analysis that is used by the majority will dictate the net market direction.The market moves in the direction of the net market force which in turn comes from the majority. A conservative use of popular  technical indicators is what enables traders to make the same analysis of the market as the majority at any time. One of such most used technical indicators is Fibonacci tools. This tool has been discovered for over a century and they still work like fire.

Sunday 14 May 2017

How to trade forex support and resistance breakout

Market prices are always on the move in the market and what drive them are demands and supplies.
The high price from where price tends to go down is called resistance while the low price from where price tends to rise is called support.

Price action traders build their trading strategies around support and resistance levels.Most of them are able to trade creatively and successfully even by using naked charts.

Naked Chart Trading Strategy is simple to understand, powerful in action and reliable in returns.
It is the practice of trading without using the numerous technical indicators that abound on MT4 platform. This method is considered necessary due to the complex and lagging nature of the technical indicators.

Typical support and resistance are significant horizontal price levels.Such level is the clearest line on the chart which shows most significant value areas and it is drawn through the swing highs or swing lows on any time frame of any currency pair.

 The chart above shows a red horizontal line drawn through a swing high.The turning point where a rising price reverses and starts falling  is called "swing high." Every swing  high will remain a resistance until it is broken. A resistance becomes support once it is broken.
Resistance is a point at or around which bullish momentum ceases and bearish momentum springs up.

 The  diagram above  is EURUSD hourly chart. It shows that price was moving slowly and sideway below the resistance (red) line and later gained upward momentum which facilitated the collapse of the resistance.The resistance was tested and broken by price.The price broke through and rose strongly above the the purple swing high (the red circle indicates the breakout point). Historically,this move came in resonance with the activities surrounding the US presidential election in 2016.
It rose to as high as 1.1299.This is about 155 pips in few hours.

The support and resistance breakout strategey is a technique which works well and it upholds that traders are to buy above the swing high and set take profit at the next higher swing high.

The EURUSD chart above shows where I bought the pair and fixed my take profit level when I was using the breakout strategy.
In the event that you are new to forex trading and you wish that more light is shed on this post, please do not hesitate to send your email to me.


Saturday 13 May 2017

How to use 50 and 200 EMA

Moving averages are indicators widely used by forex traders.Although there is no optimum parameter for any technical indicators such as moving averages, yet experience has proved that 50 and 200 are reliable and good settings that can be used to identify the general market direction.It is also to the best of my knowledge that professional traders pay careful attention to price action and reaction around the 50 EMA and 200 EMA.The next question is, how do senior traders apply these moving averages?

 The market movers (experts and large fund managers) do use 50EMA and 200EMA to filter noise and determine trend direction.Noise occurs when there is no clear-cut direction in the market.This is usually a sideway or ranging market scenario. Trend traders tend to stay out of this kind of situation and so they need to know when buyers are leading or when they are lagging or when the buyers and sellers are in phase.This is where the moving average plays a pivotal role.It is generally accepted among traders that when the 50 EMA is moving above the 200 EMA and the market price is moving above the 50EMA, then we have an uptrend.So traders should wait for the bearish retracement towards a value area which is the best level to buy the pair.


The  daily chart above shows that the blue moving average which  is the 50EMA is moving above  the red  moving average which  is the 200EMA. Also, the blue  candle is moving above the blue moving average.This means the pair is in an uptrend.

Similarly, when the 50 EMA is moving below the 200EMA and the market price is moving below the 50EMA, then we have a downtrend.So traders should wait for the best bullish retracement level to sell the pair.


The EURUSD daily chart above shows that the blue moving average which  is the 50EMA is moving below  the red  moving average which  is the 200EMA. Also, the red  candle is moving below the blue moving average.This means the pair is in a downtrend.It is a safe practice to sell high in a confirmed downtrend.So, we need a bullish retracement in a downtrend to open a short position.

It is not enough to know the trend, in order to trade sensibly, we need to know where it is safe and profitable for us to join the trend even though we know that the trend is our friend.The simple rule is to "buy low and sell high and sell high and buy low."
To do this we need to switch to lower time frames like 4 hour and check what is happening.When 50 and 200 EMA indicates uptrend on daily chart, we will switch our chart down to 4hour time frame and wait for the 50 and 200 EMA to indicate downtrend.This means that we have a downtrend on 4 hour and uptrend on daily chart.The  downtrend on the 4 hour chart is  the bearish retracement of the bullish move on daily. We need patience to wait until  we have confluence on the 4hour time frame. That is , we need to wait for the expiration of the bearish move on 4 hour and grab any logical selling opportunity that occurs at the break above either 50 EMA or 200 EMA on 4hour time scale.
Then we will buy just above the 50 EMA or 200 EMA with  our take profit on the next resistance on daily time frame.

The chart above shows that USDCHF is just bullish on daily chart.It is bullish because the price is moving above the blue and the blue is moving above the red moving average. By interpretation of the relative movement of price with respect to the moving averages, we say the trend is up.Hence the daily trend is up.The next effort is to determine where to join the trend using the 4 hour chart.


The chart above is USDCHF 4hour chart in which the trend was down and now bullish. Now we have a confluence on daily and 4hour charts.The decision is to buy on 4hour as the blue candle rises above the red moving average and place take profit at 0.9997 which is the next resistance on daily chart. Our stop loss should not exceed half of our take profit and a good trailing stop like 80 pips should be applied.

Another good example is the signal from the EURUSD daily chart below, we know that the prevailing trend is down.
Switching down to the 4hour chart we have the chart below:
 
The chart above is EURUSD 4hour chart in which the trend was up and now bearish. So the two charts (daily and 4hour) are indicating downtrend.Thus we have a confluence on daily and 4hour charts.The decision is to sell on 4hour as the red candle falls below the red moving average and place take profit at  the next support on daily chart. You may please forward your question or leave a comment.


Sunday 7 May 2017

How to determine key price levels in forex trading

In 2010, I published this method on forex factory and it has undergone several modifications since then. The goal is to obtain a new  mathematical model which uses a single and very important price of a currency pair to derive other significant supports and resistance price levels. In a nutshell, we need a single fundamental price to generate other derived prices. Many years have come and gone and so modifications have been made to the original equations to accommodate market dynamics.This formulae is compatible with long term strategies (breakout, bounce or hedging).


This is a  long term trading oriented idea and as such it  requires that the fundamental price is a long term product. Therefore, the fundamental price can be any of the following:

-The opening price of the year (opening of first trading day of the year). This is easily seen on weekly or monthly charts.

-The opening price of the month (opening price of first trading day of the month). This is easily seen on daily charts or the opening price of the recent monthly candle.

-The opening price of the week (open of first trading day of the week). This is easily seen on 4-hour chart or the opening price of the recent weekly chart.

For example:
We want to generate key levels for the yeaar 2016.The first step is to determine the fundamental price of the year 2016.This is the open price of the year 2016.It means we have to  open either weekly or monthly chart of any currency and check the open price of the first trading day of the first week or first month (January) of the year.

The chart above is a good example from  the monthly chart of EURUSD. The open price of 2016 was 1.0871.Look at the blue horizontal line on the chart.

Calculations:
Let us denote the fundamental price which is also the open price with letter M. 
From the chart we found that the opening price of 2016 was 1.0871, hence M = 1.0871
We therefore have, from the calculations using the formulae, that the remaining derived prices for 2016 were
Support Price Levels:

S1 = 0.9844  multiplied by  M

 S2 = 0.9688 multiplied by  M

 S3 = 0.9375 multiplied by  M

S4 = 0.875  multiplied by M

S5 = 0.75 multiplied by M

S6 = 0.5  multiplied by M

Sc = 0.0 multiplied by M

Where Sc is state of collapse.

Resistance levels the formulas:

R1  = 1.0156  multiplied by M

R2  = 1.0312  multiplied by M

 R3 = 1.0625 multiplied by M

 R4  = 1.125 multiplied by M

 R5  =  1.25  multiplied by M

R6  = 1.5 multiplied by M

 Rc  = 2  multiplied by M

Application:
Now let us apply the formulas to EURUSD  to determine the major support  and resistance levels for the year 2016. Remember that M = 1.0871 for EURUSD in 2016.
Hence;

R1  = 1.0156 X 1.0871 = 1.1041

R2  = 1.0312  X 1.0871 = 1.1210

 R3 = 1.0625 X 1.0871 = 1.1550

 R4  = 1.125 X 1.0871 = 1.2223

 R5  =  1.25 X 1.0871 = 1.3589

R6  = 1.5  X 1.0871 = 1.6307

 Rc  = 2.00 X 1.0871 = 2.1742

Now applying this to EURUSD, We have that:


S1 = 0.9844  X  1.0871 =1.0701

 S2 = 0.9688  1.0871 = 1.0532

 S3 = 0.9375 X 1.0871 = 1.0192

S4 = 0.875 X 1.0871 =  0.9512

S5 = 0.75 X 1.0871 =  0.8153

S6 = 0.5 X 1.0871 = 0.5436

Sc = 0.0 X 1.0871 = 0.0000

Any trained traders will easily know and appreciate the relevance of the levels.The levels are important and traders should watch out for price actions around them.They can be used for entry as well as exit prices. A breakout trader can use them and so can a bounce trader. It must be noted however that a broken support becomes resistance and a broken resistance becomes support. You can leave comments or questions here. I am the author of this blog. I can write for you on your forex blog too for a token.


Saturday 6 May 2017

Simple bearish breakout strategy for beginners

Breakouts lead to momentum and momentum is the aroma of forex trading.It is therefore necessary to devote quality time to learn and understand the concept of breakout and the opportunities that follow it.Some traders build their strategies around true breakouts while some maximise false ones. I tend to use the two most of the time.Today, I am going to explain how to use a very simple daily trading strategy to generate selling signals.
The strategy is designed for selling any chosen pairs. It uses daily chart. Anyone who wants to use this method must know how to identify OHLC on a daily chart of the currency pair of his or her choice.
We choose to capitalise on price action around the  low of the previous day.We expect to sell today once the market price moves down and breaks the low of yesterday. It is therefore a momentum based approach.One good thing about this kind of methods is that they enjoy high acceleration towards the profit target and therefore have high success rate. How to trade momentum in forex.

courses on forex ad 2 
For example,let us say that we want to trade on Tuesday. All we need to do is to  check the low of Monday candle which was the previous day candle with respect to today. We will place our sell order at 5 pips below the candle and set our take profit  as 100 pips, stop loss of 40 pips and trailing stop of 40 pips. The take profit and stop loss are essentially at the discretion of the trader especially if you are already a star trader. How to use momentum indicators  to confirm trend in forex.


The favourite or recommended pairs for this  method are EURUSD,  GBPUSD, USDJPY, USDCAD, USDCHF and AUDUSD. AlthougH this works in any market that has OHLC.  I use this method on daily charts and for selling currency pairs.
I am the author of this blog. I can write for you on your forex blog too for a token.

How to find overbought forex price using Fibonacci

Sell high and buy low is one of the most popular instructions that characterise the market.In the same vein, forex traders keep asking that at what point do we have oversold  in an uptrend and overbought price in a downtrend? How to detect forex market trend.
The first thing to look out for on the chart of  any currency pair  is the most present trend which is also the net market direction over a reasonable quantity of time.Knowing the prevailing direction of the market prices is not a big deal for any trained forex trader.It is already  an established fact that there is greater tendency of success whenone is trading in phase with the trend.If you are still finding it hard to identify the main market trend at any time then read more on forex trend. It will surely help you a great deal. How to trade in the direction of the marrket trend

While many traders know how to identify where the market prices may be going at a particular time, they still struggle at knowing the salient price to sell in a downtrend in order to maximise their profits and minimise possible losses.Forex articles: How to increase your forex profits significantly and consistently

courses on forex ad 2
 It is very easy and profitable to sell in a downtrend. All there is to it is to identify if the trend on daily or any other time frame is bearish. Then wait for price to move mildly upwards ( retracement) to atleast  Fibonacci level 38.2% or  61.8% .We can say that a pair is overbought when it stops going down and starts going up and gets to either 38.2% or 61.8% in a confirmed downtend. This is the type of set-ups that enable traders to sell high in a downtrend.The level 38.2% or 61.8% becomes the decision zone and any selling signal generated around here gives huge profit potential. How To Use Fibonacci Tools

The diagram above shows EURUSD on a daily chart.It is clear from the diagram that the pair is in a downtrend. However, the price stopped going down at a point and started going up until it got to Fibo 38.2%. This level posed a strong resistance to the rise  as seen in the yellow rectangle above.I think you can see that we had a top around the 38.2 level and price resumed the fall again with greater momentum.

At times, my take profit is 100 pips and my trailing stop is 40 pips. My favourtite currency pairs are EURUSD, USDCAD, GBPUSD, USDCHF, USDJPY and AUDUSD. Money management is a personal policy and I ususally risk 1% or 2% per trade.You may please send your email to me or leave comments. I am the author of this blog. I can write for you on your forex blog too for a token.